
Fabrice Cadiou - Head of Customer Success
The current geopolitical context has many and not insignificant consequences, among which the cost of energy is a central concern.
The needs are obvious:
The problem is this: we cannot optimize what we do not measure!
Machinery is the main source of information when it comes to production. Consequently, connecting your machines means taking advantage of all their capabilities and recovering the right and useful data to exploit them.
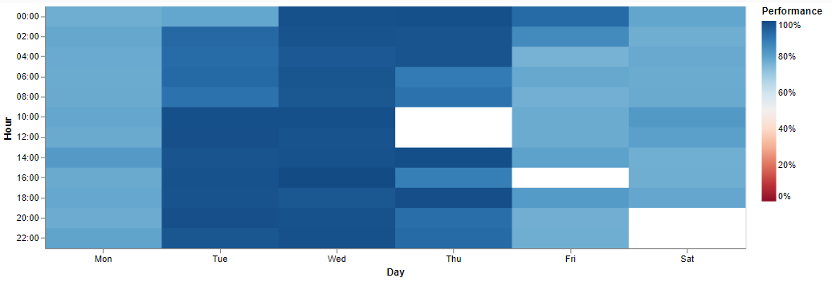
The analysis of these production data allows to establish a heat map representing the production performance according to the days and hours over a given period.
For example, we carried out the exercise at one of our clients.
This representation highlights the periods during which the machines are the most efficient and therefore the production is optimal.
Over this period (1 week), the production machines reach their optimum performance mainly on Tuesdays, Wednesdays and Thursdays except from 9am to 1pm.
On the other hand, we observe lower machine performances on Monday, Friday and Saturday.
In order to achieve an energy saving of 10%, it is interesting to correlate this graph with the price of electricity. The Machine Relationship Management solution is the right solution because it ensures easy integration of third-party applications, and thus in this case with the RTE API.
By defining a consumption pattern, based on the previous week, we can predict (to an equivalent day) future peaks and daily changes. Decision-making is thus facilitated for the industrialist, who is in a position to intelligently adjust his production according to the cost of electricity.
In our example, our customer decides to stop production when the machines are the least efficient, on Thursdays from 9am to 1pm and on Fridays from 3pm to 4pm.
Time slots where the cost of electricity is the highest are also suitable for planning maintenance operations.
This solution offers a potential saving of 10%.
In other countries, including Sweden, this solution is already in place. As the price of electricity changes over the course of a day, industrialists follow trends in order to adjust their production while achieving significant savings.
Discover our applications:
Related News