

Renaud Parent - Senior Software Engineer
Visualizing data is crucial in order to explore and understand it.
Sometimes, explaining a physical problem out of data is just about finding the right representation for it. A well-designed diagram is often worth better than a thousand words of explanations.
At InUse we believe that every data use case has its suited set of representations. That’s why our platform provides a wide variety of visualization builders (Dashboards, Synoptics, Reports…). We aim to make all existing types of charts available for exploration and content production. In our builders, most common visualizations, such as Lines and Bar charts, KPIs, Data tables, Gauges… can be set up through intuitive interfaces with a few parameters to adjust. But it is also possible to build more complex ones, by using our Vega and Vega-lite integration. Supporting Vega in Dashboard and Synoptics opens up the possibilities to set up specific representations of your data. This integration was already available for Dashboards, and is now also integrated in our Synoptics builder.
Let’s see how data visualization has helped our customers through some examples.
PureCleaning is a connected service provided by InUse to optimize Cleaning in Place (CIP) in production sites. The service provides recommendations in order to reduce CIP time and water consumption.CIPs are performed by Cleaning stations that have the charge to clean a certain number of equipment in the factory via cleaning circuits.
Optimizing CIPs duration has the nice side effect of increasing the availability of a station. A question of sizing then occurs : can we plug more circuits and equipment to the existing stations ? When do we need a new one ?
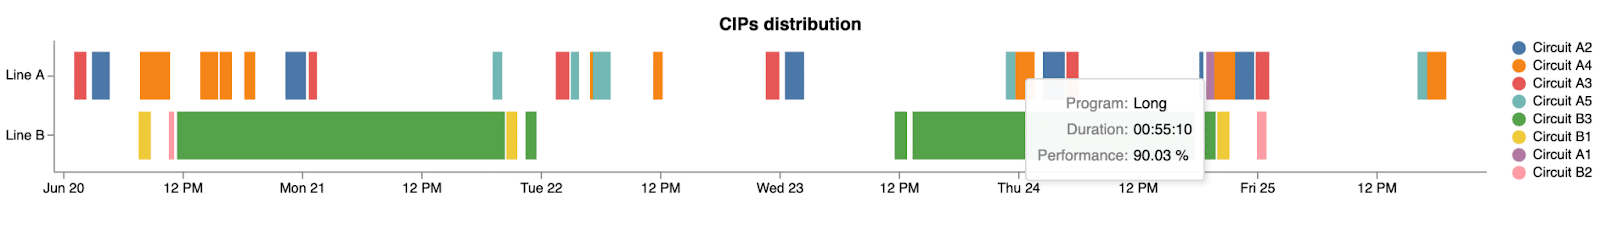
The way to evaluate the machine availability is by looking at the data. If we find enough idle periods for the station, then it might support additional circuits. This Gantt diagram summarizes well the cleanings performed by the CIP station. Idle periods appear clearly.
Factories that output batches of products from raw materials often have traceability constraints. For example, they need to be able to go all the way back across the production lines to the raw material, from an output product that has quality issues. This can become quite complicated when the process is not linear and that several machines can work in parallel, with multiple material transfers. A good way of representing incoming and outgoing transfers is to display them in a Sankey diagram.
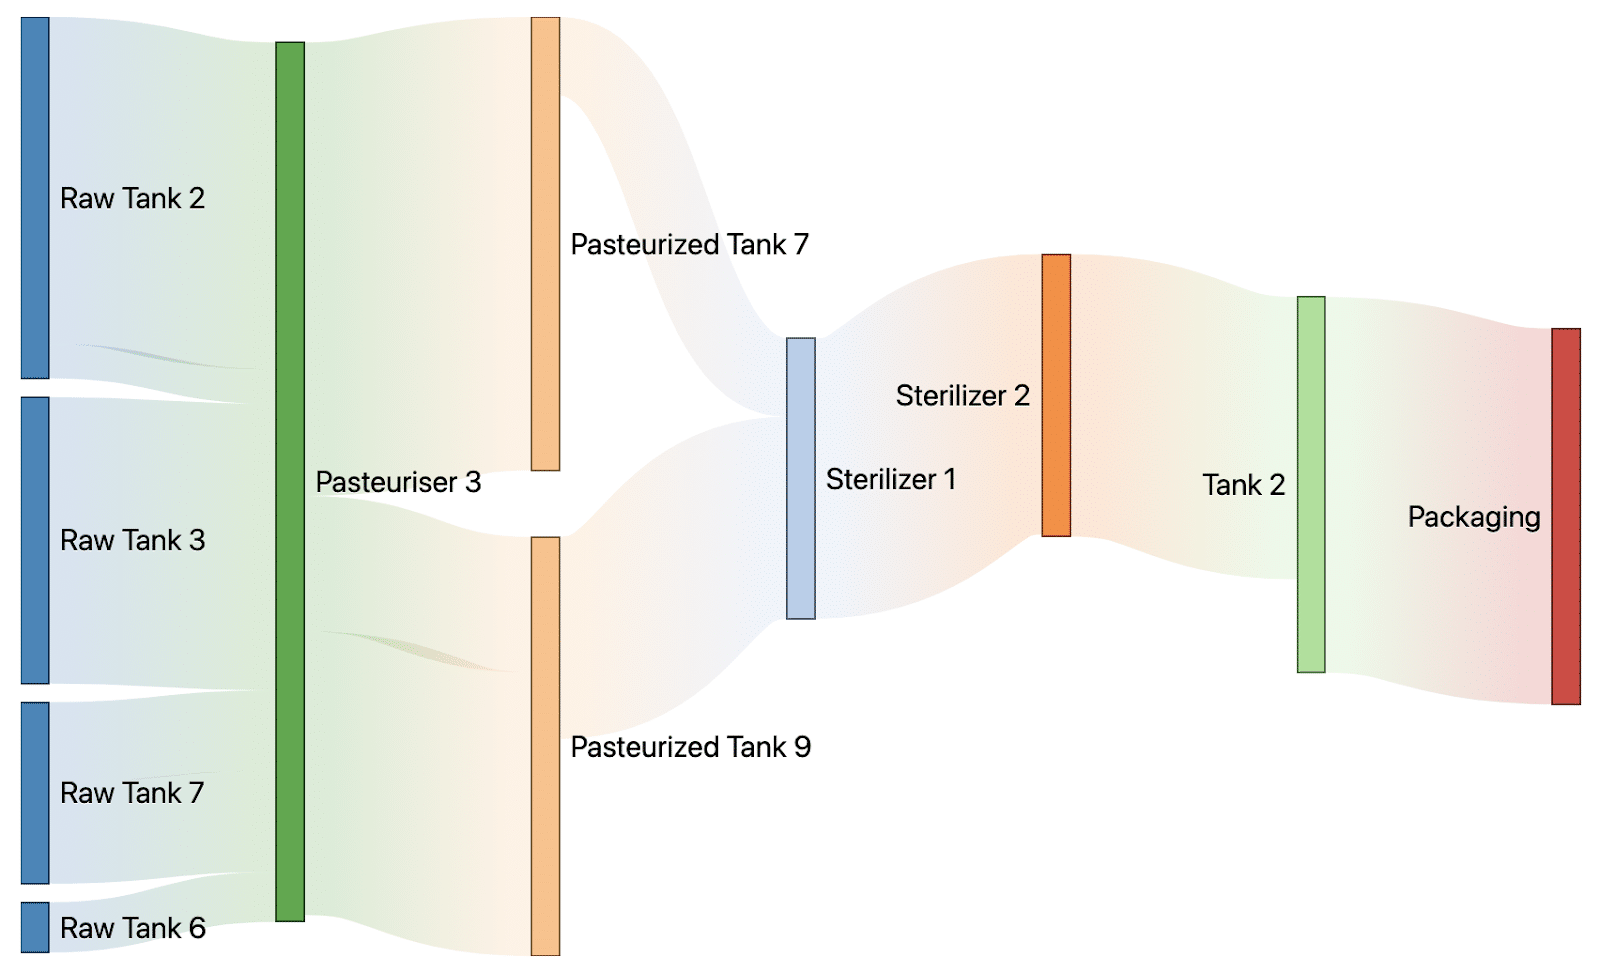
Here we quickly see all the equipment that are involved in the production of the batch to be traced : from raw materials on the left until the packaging line on the right.
Data analysis can provide useful insights on how to improve the overall performance of an equipment. To produce a batch of products, you provide a recipe as an input (i.e. a set of parameters to be applied), and you can then observe performance indicators of the output batch. Scoring batches is useful to compare recipes and see which ones perform best.
To understand why some recipes have good or poor performance, you need to understand which parameters of the recipe have influence on the final result. For this analysis, matrices of scatter plots can efficiently give first hints on how the parameters influence the performance.
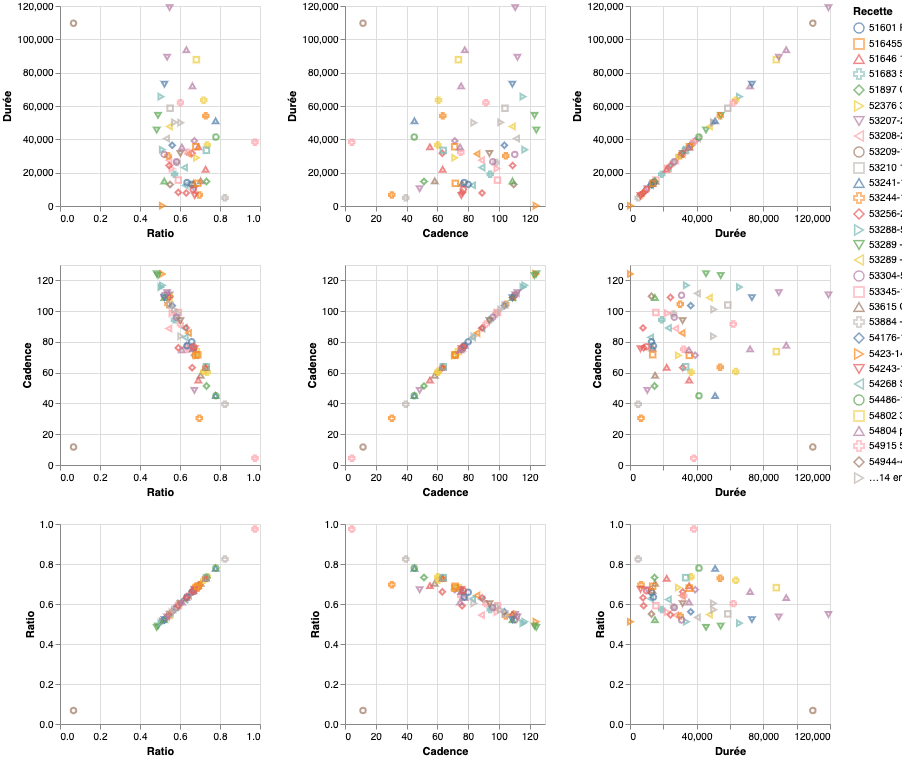
In this example, we try to find which variables have influence on the ratio of a recipe. We can clearly see that duration does not seem to be correlated to the ratio, whereas the cadence shows a very clear correlation. One can see very clearly that increasing the cadence lowers the ratio. Based on this visual analysis, it appears that increasing cadence of a recipe beyond a certain point should be avoided.
Now it’s your turn to create your own visualizations and extract the best out of your data ! Don’t hesitate to contact us, we can help in the process of choosing and setting up the most suited representations.
Related News