
Guillaume Thomas - CTO
Successfully implementing an IoT project is complex. Whether you want to build a predictive maintenance service for your customers or a smart performance application for your production team, those projects require many skills and technologies. The InUse solution is here to simplify this complexity so that you can focus on expertise. Over the years, we’ve built many tools, established a methodology and we’re all the more happy to see our customers succeed in implementing difficult projects.
Nevertheless, we’ve recently felt a gap between our methodology and the way users navigate in our application. The global navigation has slightly changed over the last two years whereas many features have since been added.
A new version of the solution is now available to all users with a lot of fantastic features such as the publish module, hosted notebooks, storage monitoring. We took advantage of this release to reshape the global navigation of the Studio in order to offer our users a smooth end-to-end data journey. First feedbacks from our privileged beta testers show great enthusiasm.

We believe that a method is all the better as it is simple to understand. The following method is a very good starting point for any projects which aims to create an application based on IoT data:
Modeling : Now that raw data is connected, it’s time to build a data model which will be the foundation on which your service/application will be based. Elaborate a data structure, write the event-based transformation rules so that you have at the end a boolean variable which is true when alert should be triggered, or a cleaned counter variable which might be plotted in a dashboard
Explore : We know that building a model is tough and requires many back and forth with exploring tools to ensure that raw data characteristics are fully understood (ex: what are the boundaries for this intensity variable? if i build an alerting model, how many positive cases will i have?…). We provide several exploratory tools (drilling dashboards, event search, notebook) to do so.
Content : Now that models are accurate and complete enough, it’s time to make it understandable and actionable for your collaborators. There are several ways to display information in the solution: through dashboards, alerts, reports, synoptics. Just pick the one the more suited to your use case!
Share : You have users, you have content, there’s everything you need to build an app. Take advantage of our great fantastic app builder to customize the layout and share the contents to appropriate people.
And voila! You have an application fitted to your data, fully configurable and respectful of your corporate guidelines in terms of security & branding. Check out below some examples from our customers.
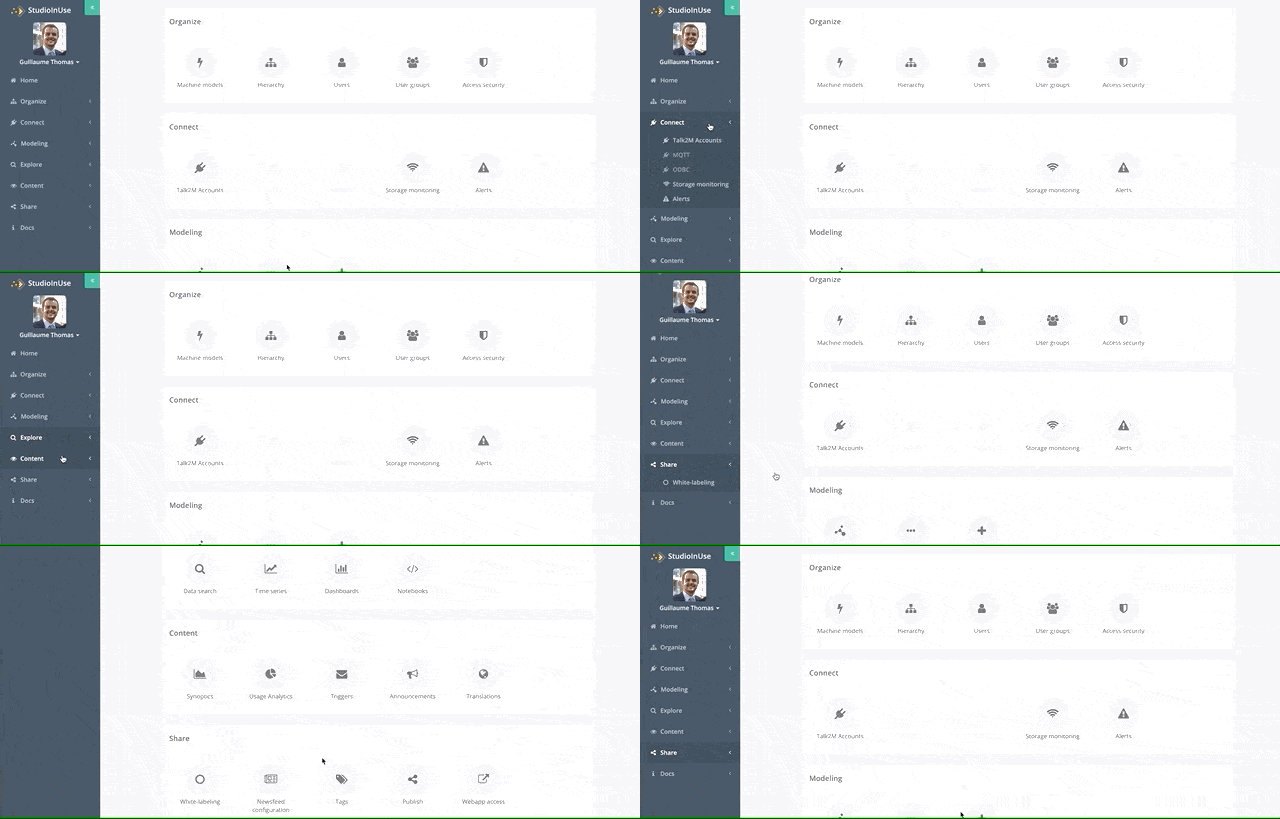
As shown in the animated image below, the left navigation menu is structured following the six steps described above. The home page has the same structure and displays a direct link to each module of the application.
Regular users will see that three new modules have appeared which are described in separated articles:
Interested ? Want to know more ? We’d be more than happy to give you a demonstration and think together on it can be used for your projects.

Related News
